OVERVIEW
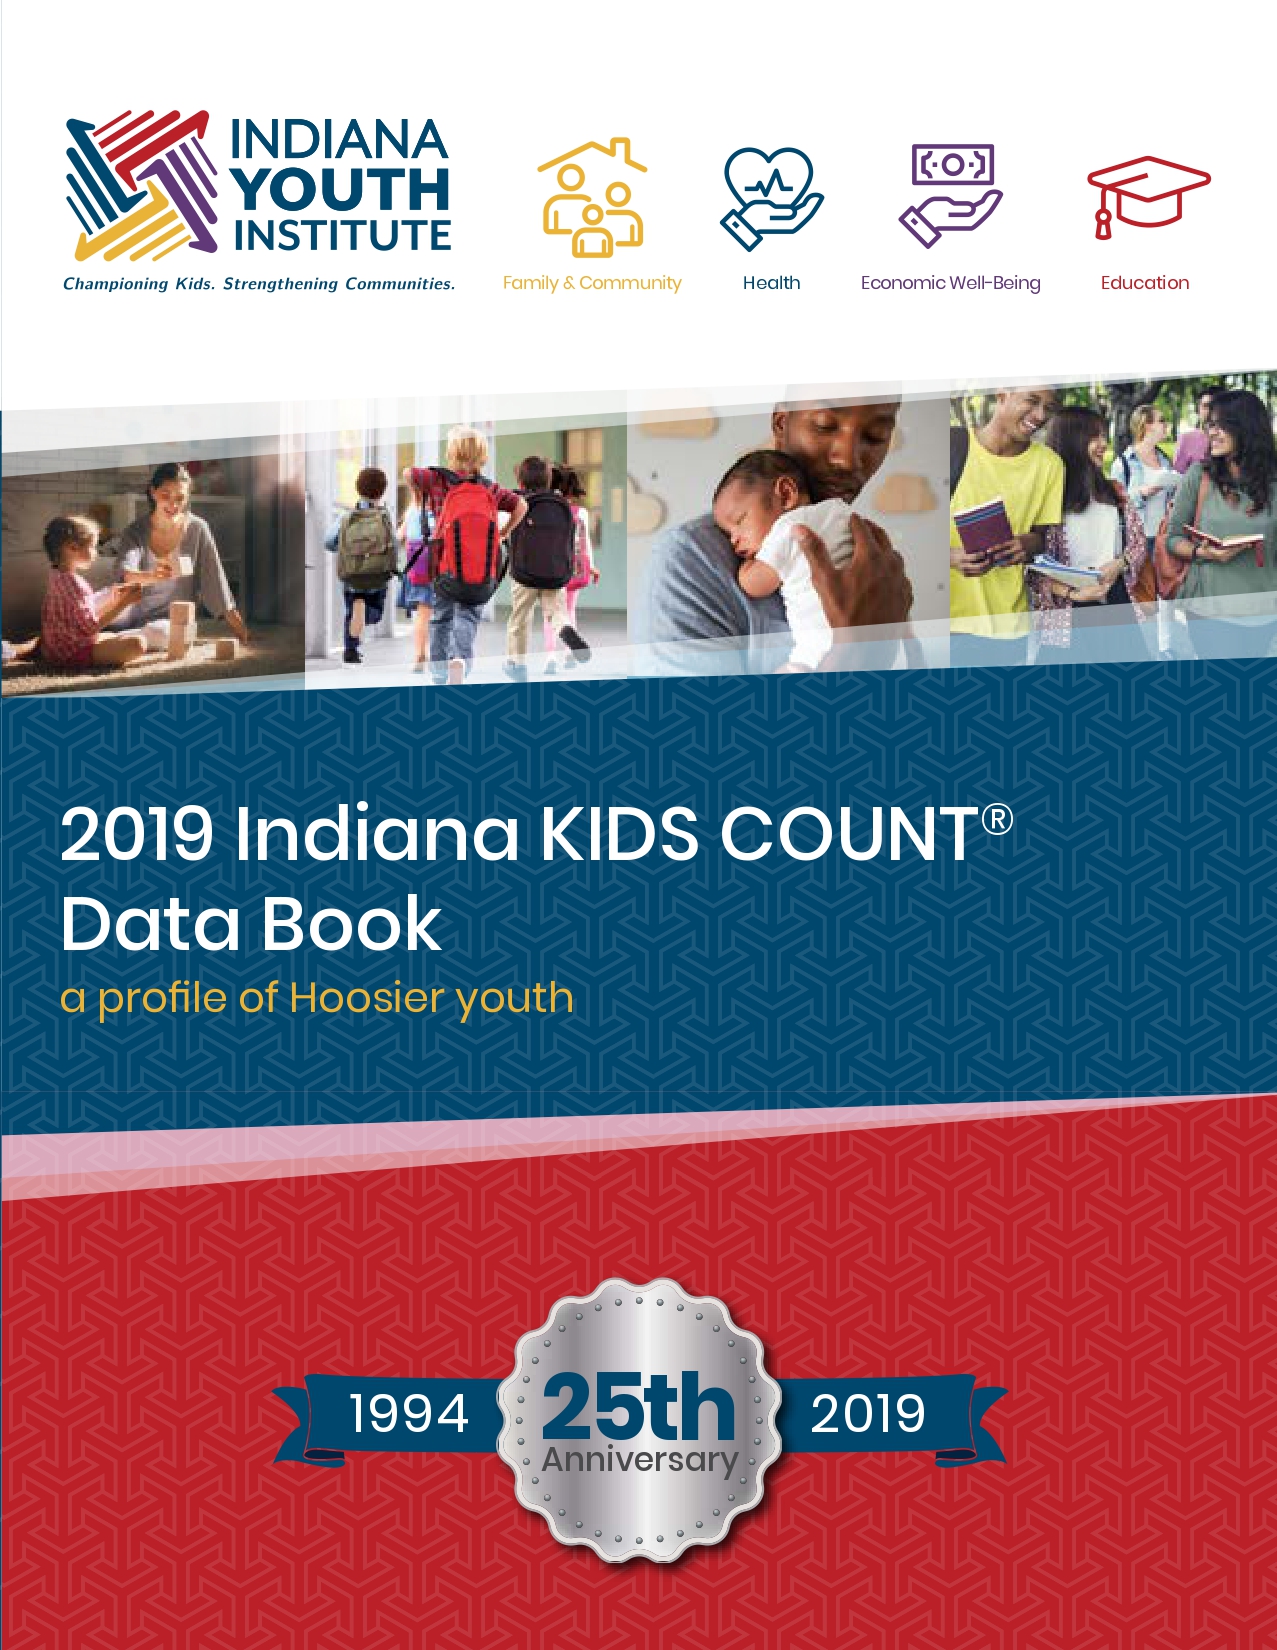
The 2019 Indiana KIDS COUNT® Data Book is the leading data resource on Hoosier youth, designed to be a go-to source for the latest research and information.
The final outcome was to produce a product that marked the 25th anniversary, implement the new brand standard, incorporate new designs, and develop new data visualizations.
ROLE & DURATION
Author, Lead Data Analyst and Visualization Creator – Ingrid Arreola | Data Analyst – Sarah Mihich-Baker, Charlie Geier | Copy Editing – Sarah Mihich-Baker, Charlie Geier, Tami Silverman | Graphic Design – Willow Marketing
July 2018 – February 2019

CHALLENGE
Planning & Priority
One of the challenges included identifying the top youth challenges in Indiana, receiving feedback from stakeholders on product enhancements, and planning the production process (i.e. researching, writing, copyediting, etc).
Researching & Selecting Enhancements
The 2019 Indiana KIDS COUNT® Data Book was the 25th anniversary and the challenge was to create an enriched product. This included identifying and prioritizing the product enhancements, aligning the product with the national KIDS COUNT® Data Book, and receiving feedback from stakeholders prior to publication.
Organizing and Creating Documentation
The biggest challenge was the lack of documentation for the massive data collection process, and the absence of a methodology for calculations.
SOLUTIONS
Planning & Priority
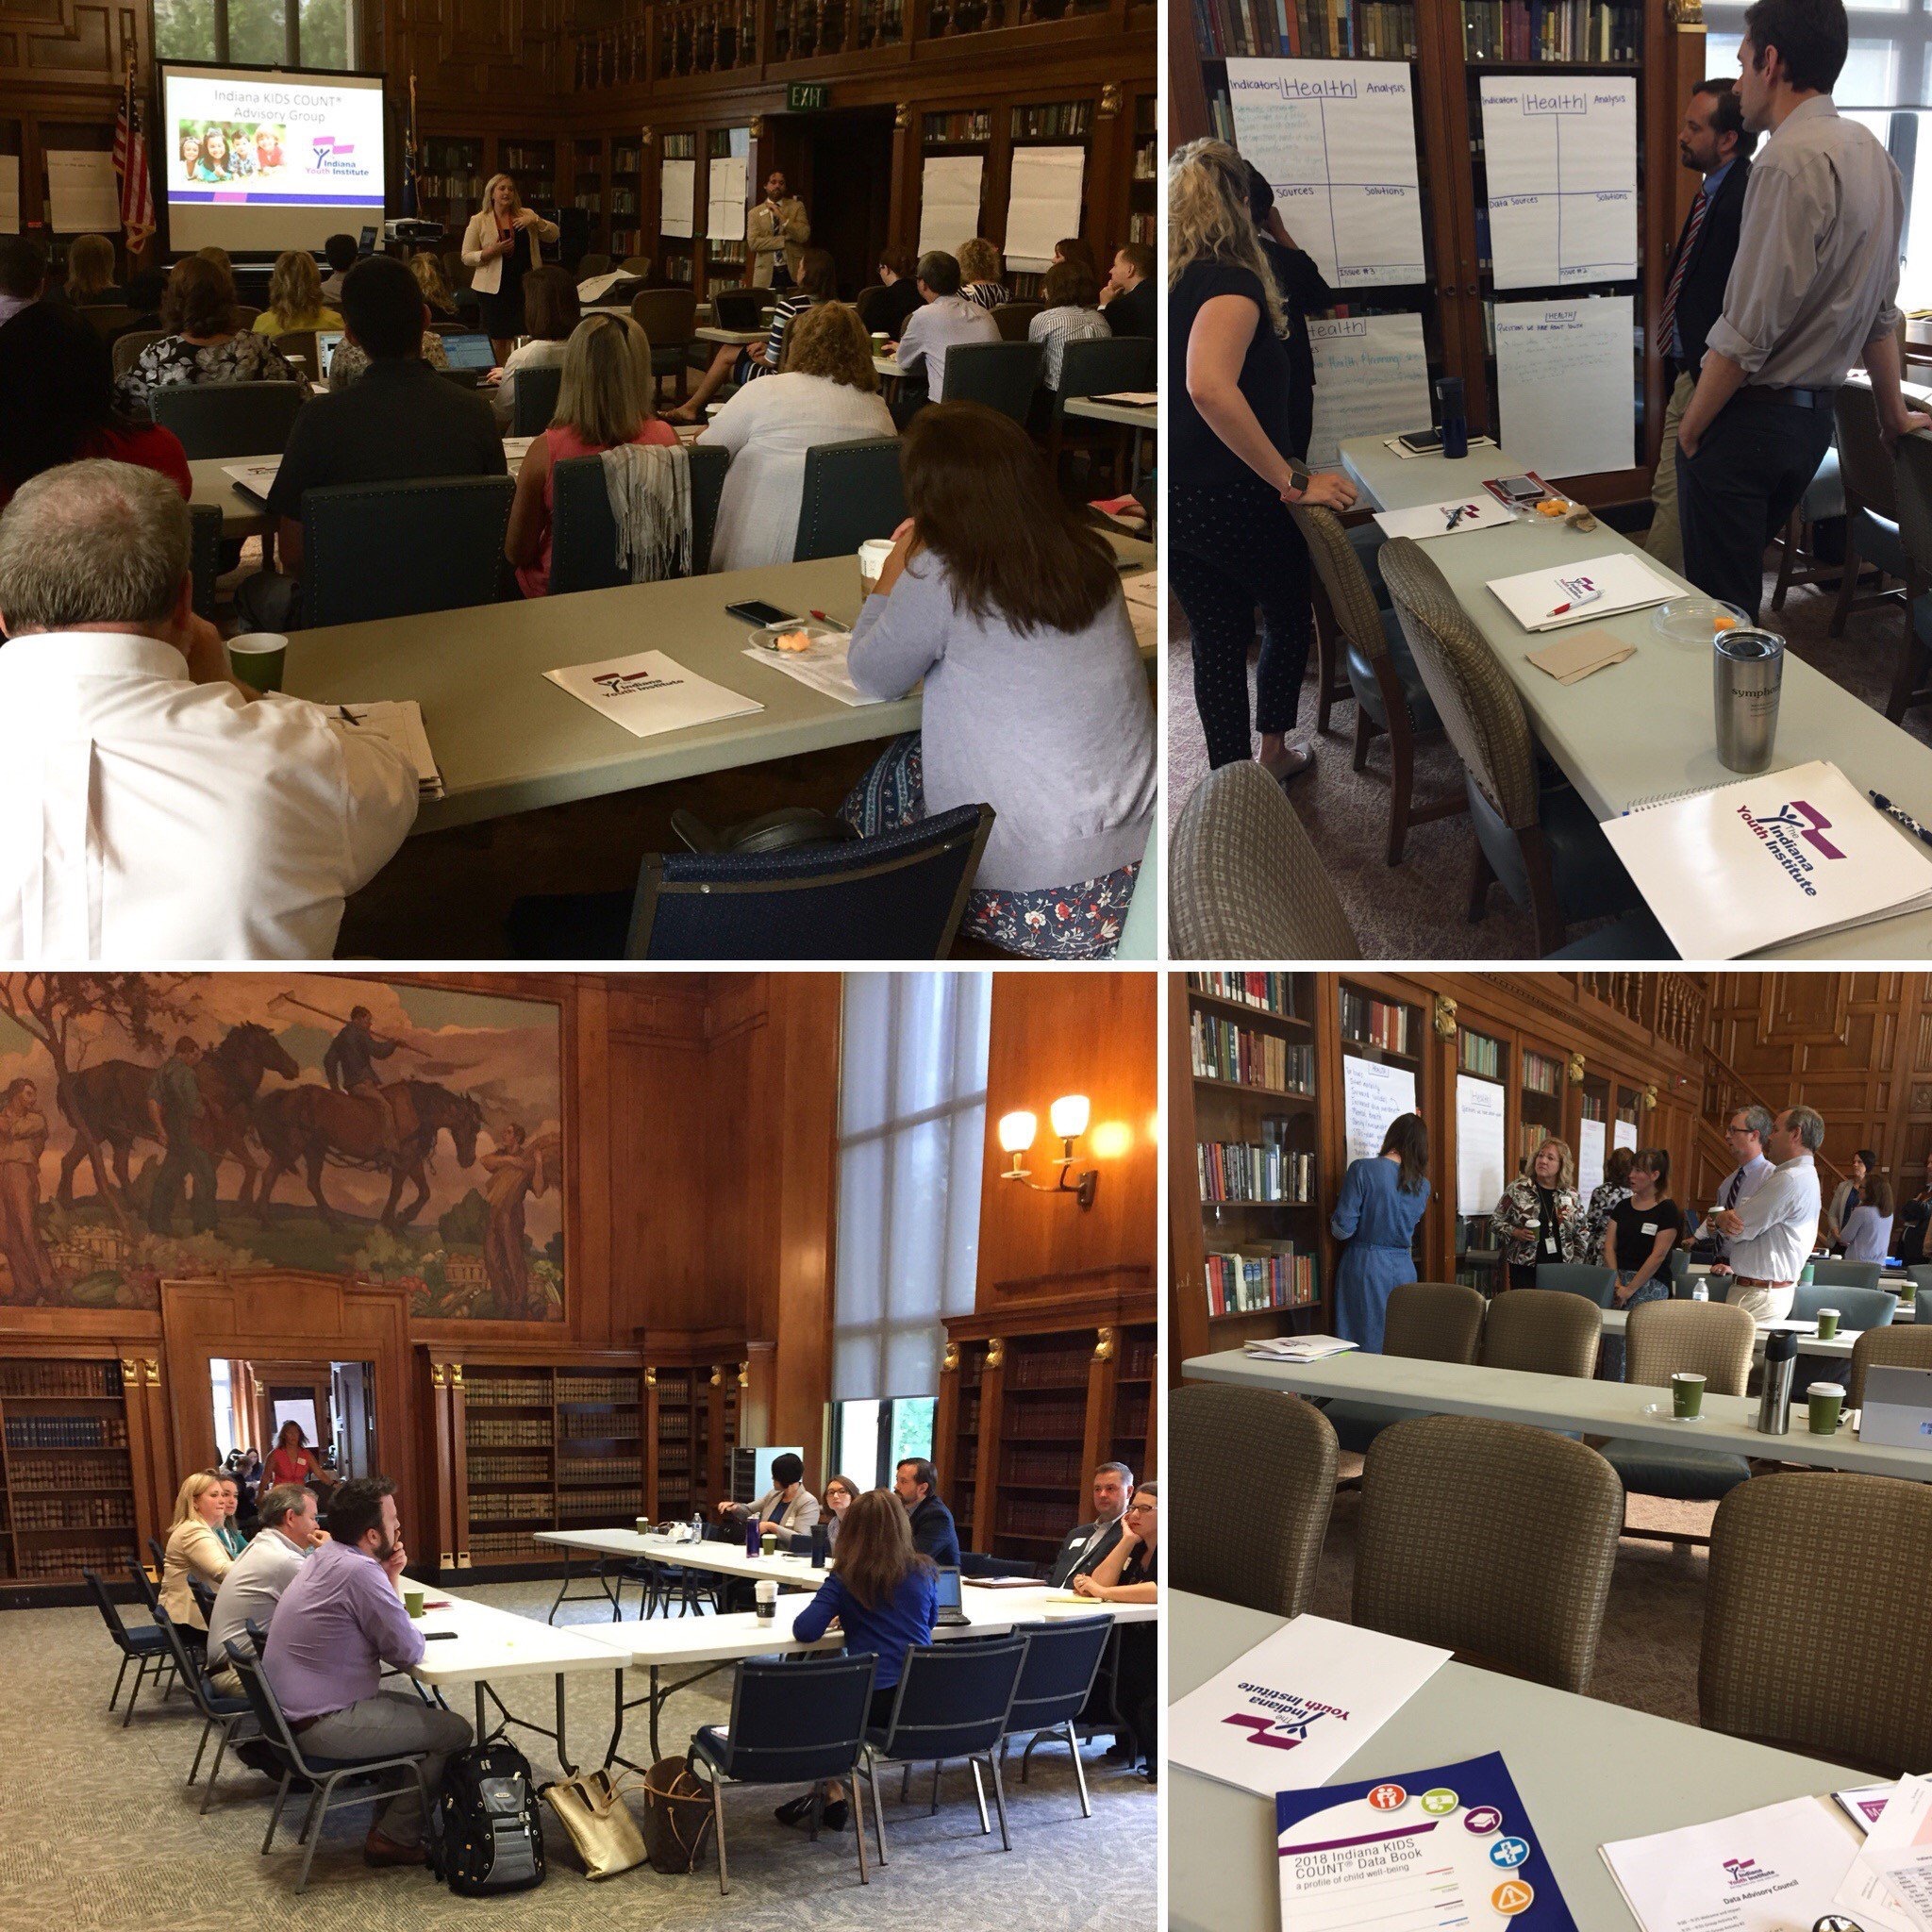
The Indiana KIDS COUNT® Advisory Group met to discuss key issues facing Hoosier youth, policy and data collection changes related to child well-being, and enhancements. The stakeholders present at this meeting included representatives from the Indiana Department of Education, Indiana State Department of Health, Indiana Department of Child Services, Indiana Department of Workforce Development, and other youth serving organizations. Feedback from this group was essential to determine top issues and receive feedback on design enhancements such as new visualization techniques and the overall design of the Data Book.
Collaboration with representative from the Advisory Group continued throughout the entire writing process. This engagement was essential in the creation of the spotlights, a two-page spread highlighting a topic. As these topics were selected I actively looked for opportunities to collaborate with members from this group.
Researching & Selecting Enhancements
The Data Team had a brainstorm session to discuss possible enhancements, researched other KIDS COUNT® organizations that produce Data Books, and analyzed customer satisfaction and recommendations.
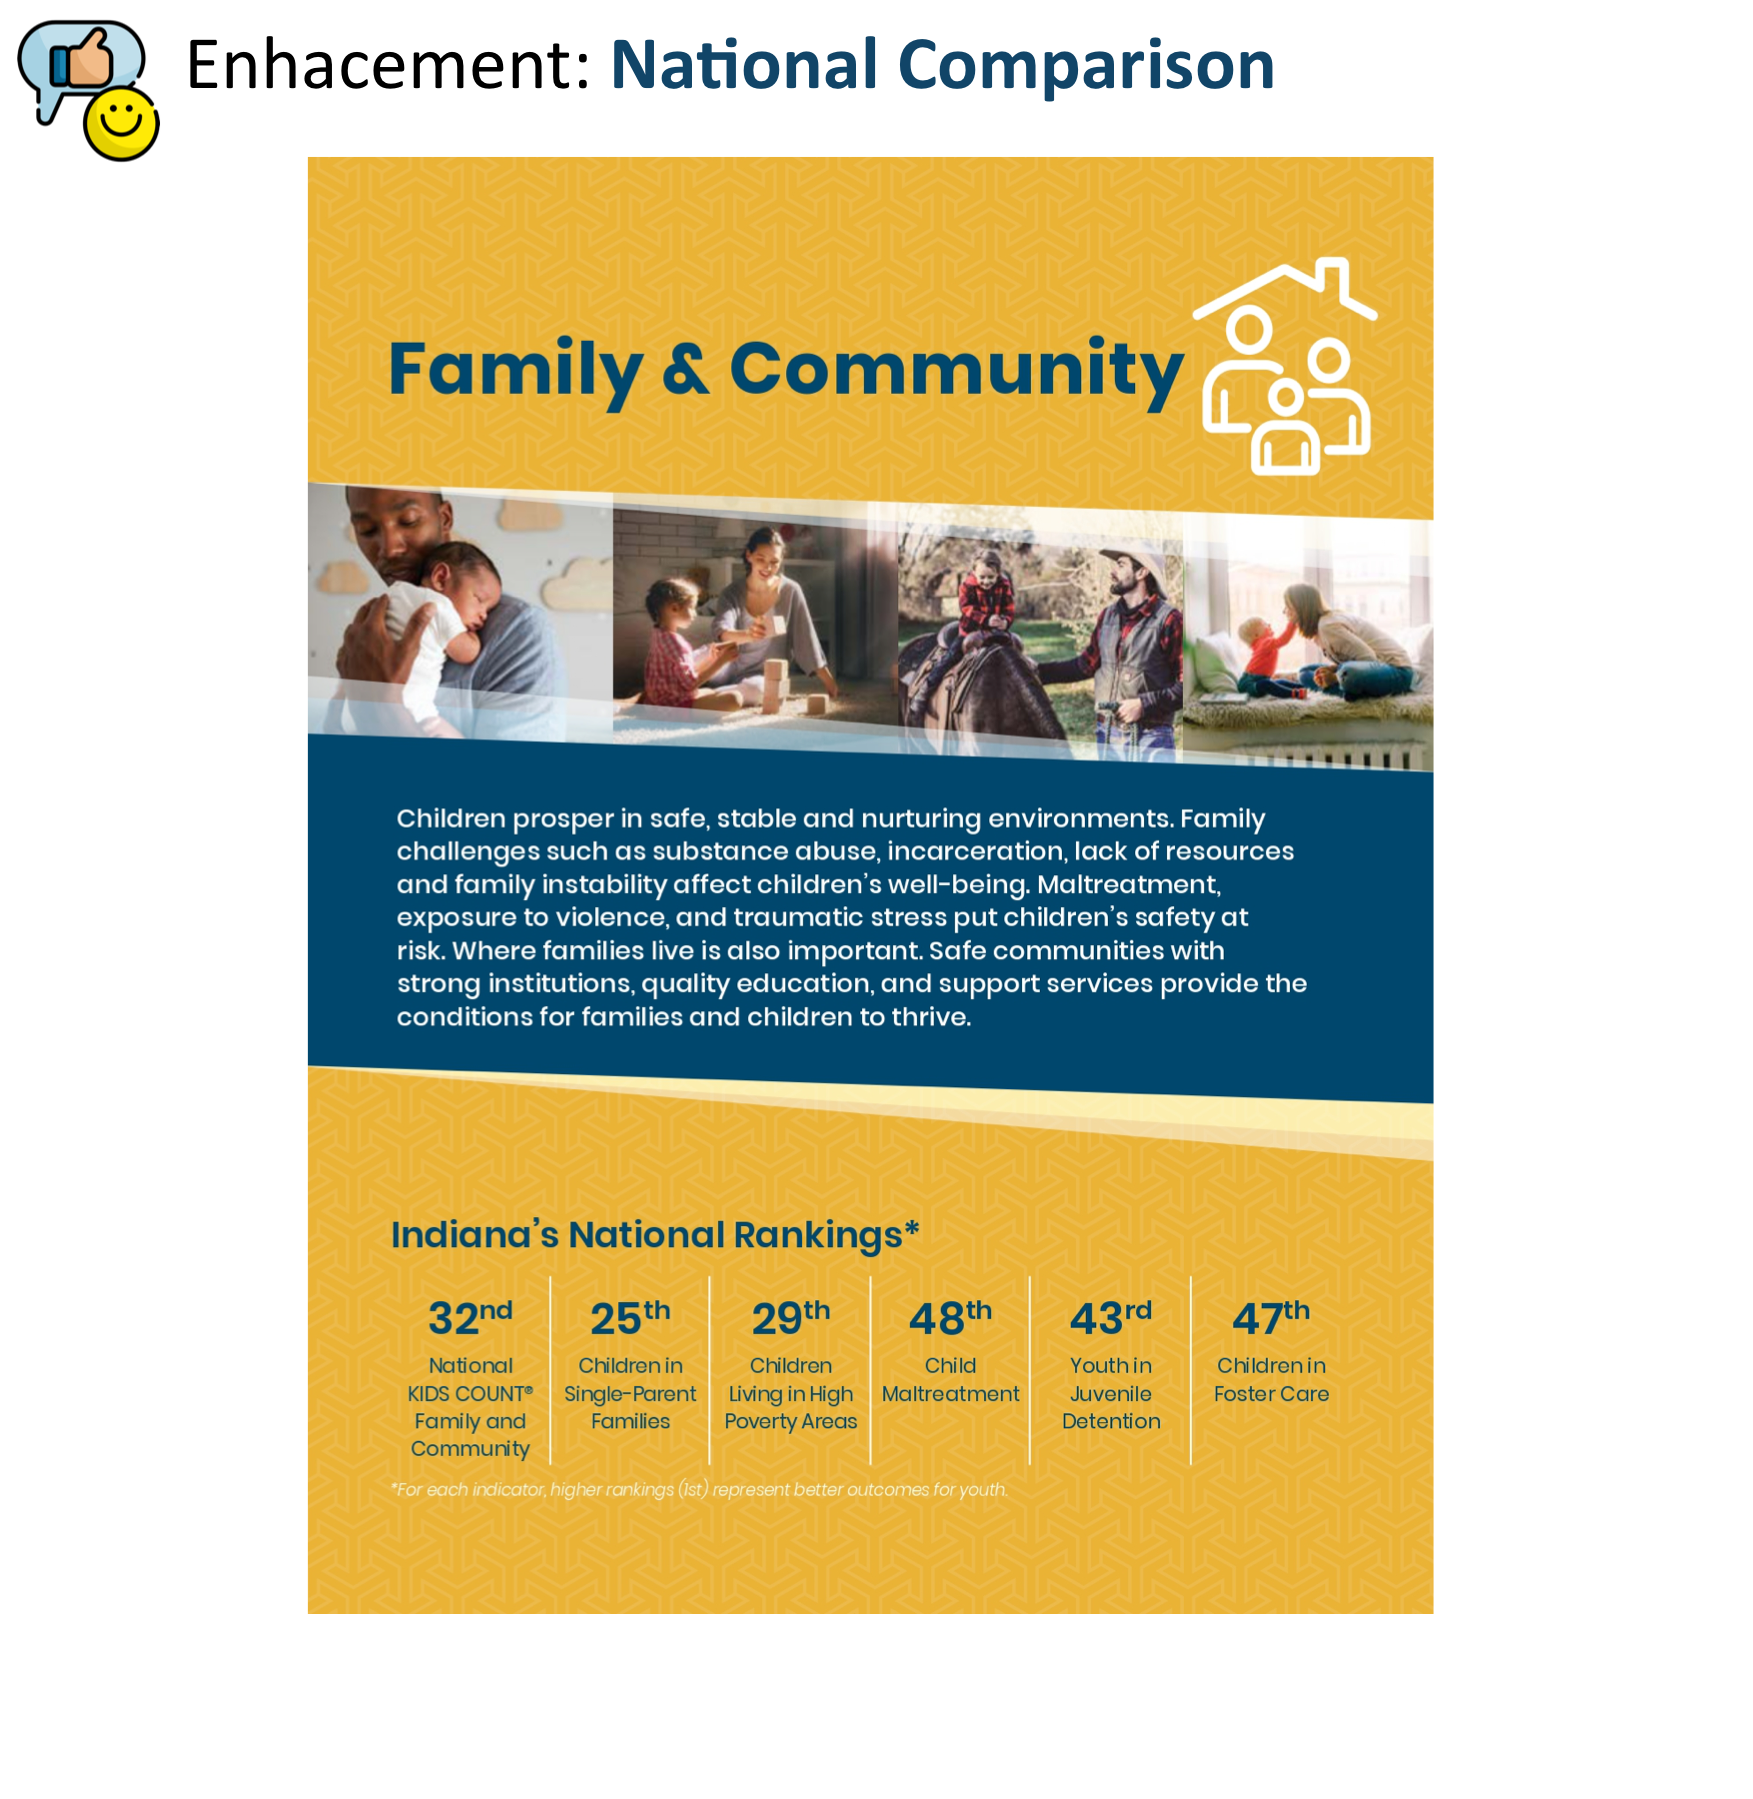
Researching other KIDS COUNT® affiliate organizations allowed our team to focus on streamlining the content to align with the national organization and other affiliates. This resulted in the creation of a methodology section, incorporating a framing section on the importance of disaggregated data, providing national rankings for each of the national data indicators, and embedding the Safety section into the Family and Community and the Health sections.

Customer feedback led to the development of new visualizations, such as map visualizations, tree maps, and the elimination of all pie charts. Quantitative data from the annual evaluation survey helped our team identify the top three issues concerning our customers. Qualitative data provided constructive feedback on enhancements to include in the 2019 Data Book. This resulted in an improvement of the overall quality and rigor of the analysis and research.


Organizing and Creating Documentation
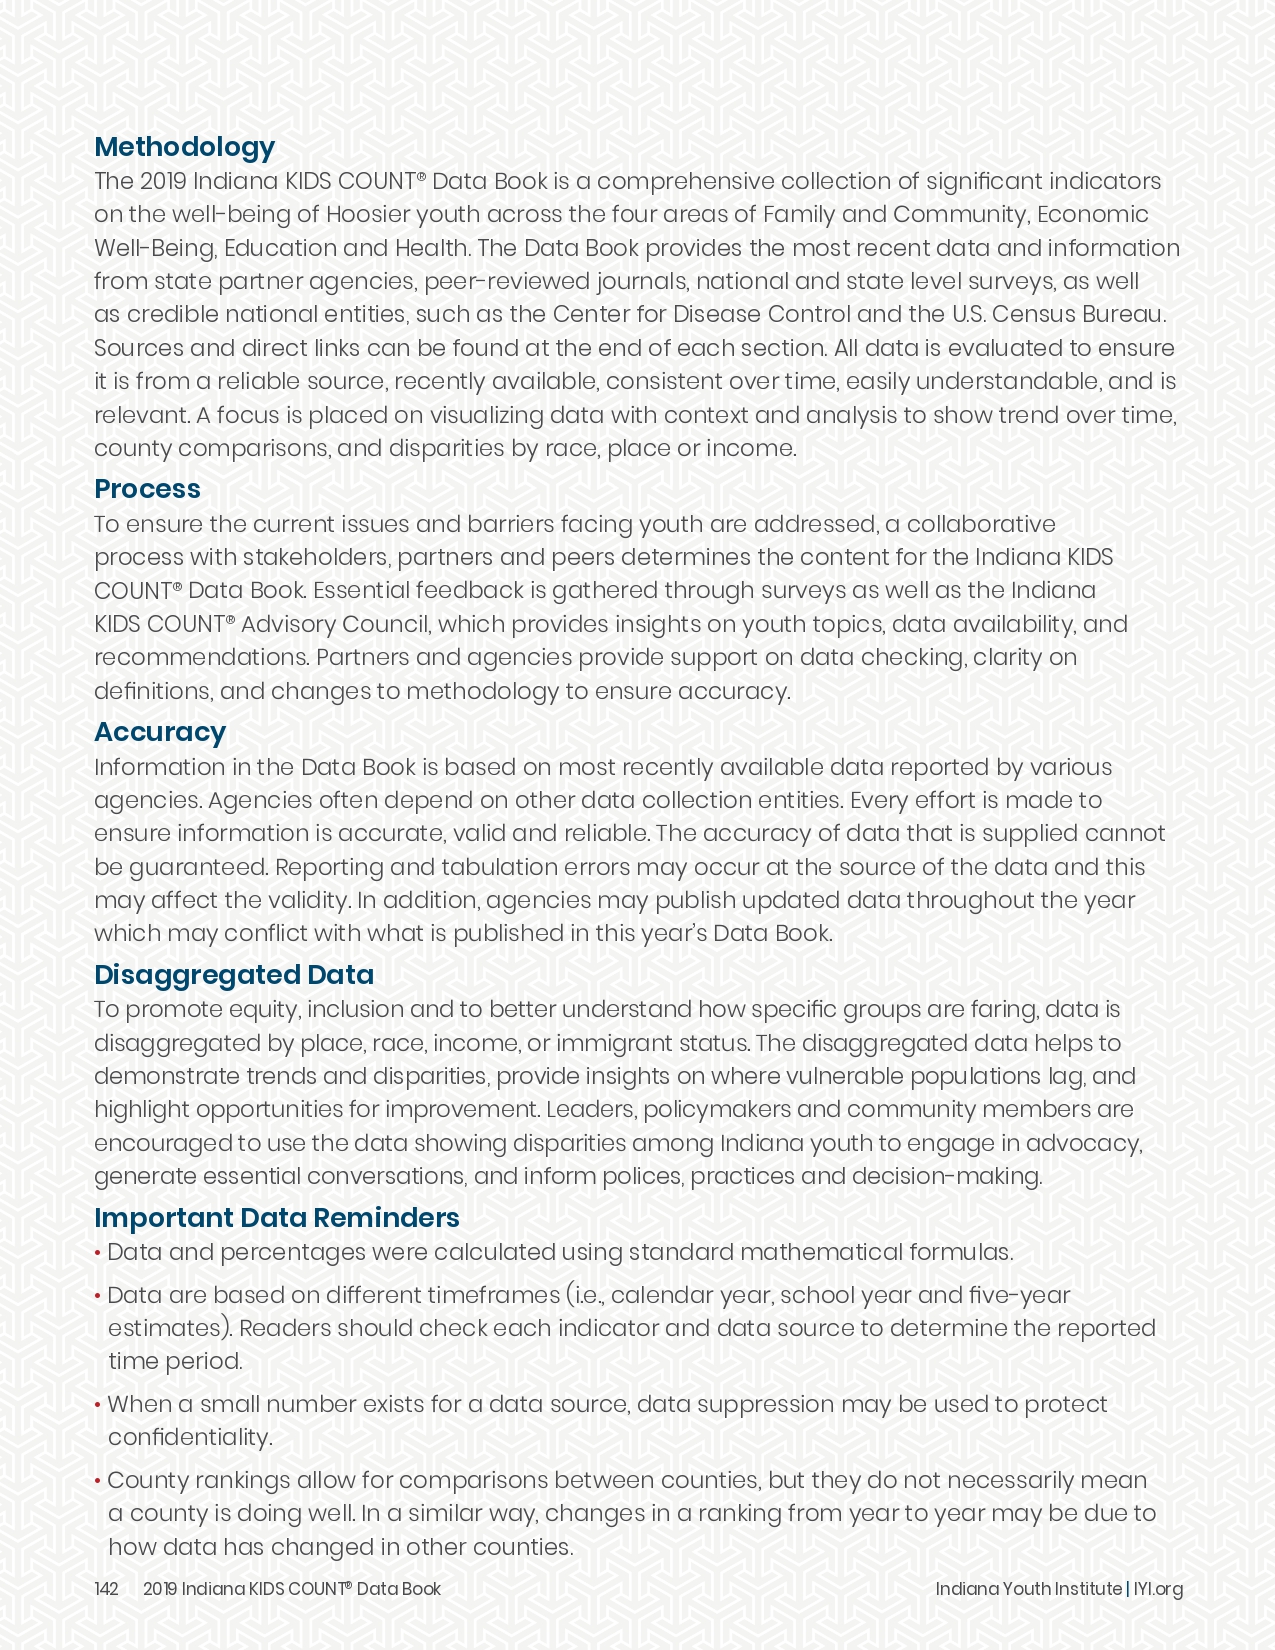
The 2019 Indiana KIDS COUNT® Data Book has 230+ data points in one section, with a myriad of state and national agencies data sources. I began creating a documentation system for the methodology, data collection, and document organization . This was an iterative process and it started with a master key for each of the four sections. This key includes details for each individual data point, sub-section, source, table number, visualization, and notes.

A methodology template was created to track the calculations and data transformation needed for this project. This methodology document was extremely helpful and used throughout the entire process, including the data check process.

IMPACT
Eight months of careful planning, data analysis, data visualization, project management, writing, and collaboration has brought the results desired for the 2019 Indiana KIDS COUNT® Data Book. We are proud to present the 25th Data Book, the new organization brand, to our customers. The final result is a robust data resource on Hoosier youth, designed to be a go-to source for the latest research and information.
300 Data Books | Distributed to 40+ Indiana legislators, 15+ federal congressional delegation, 50+ community leaders, and 5+ state agencies.
LEARNINGS
Collaboration is key
The more eyes on a design, data project, and written work, the more it’s exposed to feedback, critique, and improvement. I thoroughly enjoyed collaborating and speaking with subject matter experts.
Process is essential
A project like the Data Book can feel gargantuan. Developing processes and documentation helps construct a roadmap to navigate through what can be a misty route. This is especially useful as the product will continue to be improved.

