I have been reading #Makeover Monday by Andy Kriebel and Eva Murray and have been enjoying learning more about the Makeover Monday community and its history. I have been taking notes and want to explore diving into topics more deeply as I engage with the challenge.
This week I focused on Chapter 1: Habits of a Good Data Analyst, the tips associated with gaining a deeper understanding of the topic. The two key tips mentioned by Andy and Eva included:
- Reading and understanding the information supporting the chart being examined.
- Digging deeper into the studies/investigations on the viz being examined and asking questions such as: ‘why was the data collected and by whom?’ ‘Does the purpose give you ideas to build your own data story?’ ‘Is there interesting insight in the origins to guide your analysis?’
There is a study associated with Week 9, The Economic Value of the Bicycle Industry and Cycling in the UK. As I read I asked myself the questions to gain insights, pinpoint the key messages and understand the conclusions shared by the original authors.
The Bicycle Association of Great Britain (BAGB) commissioned a report to analyze the economic impact of the bicycle industry and cycling in the UK.
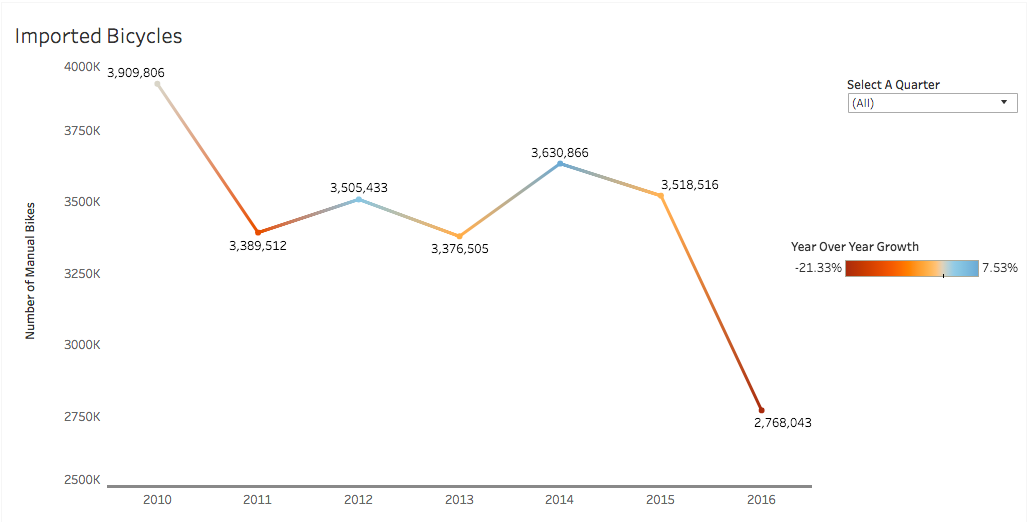
- This data has been aggregated to provide quarterly and annual time series showing the volume of bicycle imports.
- Fewer bicycles were imported in each quarter throughout 2016 compared with the same quarters in previous years.
- Gross value added (GVA) provides a monetary value for the amount of goods and services produced less their cost of production. The GVA follows trends set by bicycle industry was less than at any time in the previous six years.
I added these insights to the Week 9 dashboard with bullets like I did here, at the bottom of the viz. That can be found here.