Makeover Monday this week produced really great visualizations on the survey data for American cellphone use. As I was watching the webinar there were common themes on improving visualizations this week.
- Remove clutter and focus on the data/viz. Keep this in mind, rather than filling it with many graphics/pictures.
- Create visualizations that are compact so it is focused – if it is spaced out it can be distracting. Like Eva said, “if you can give people what they need to see on a single screen, that’s the best approach.”
- Call to actions are great, however if you are using information it’s good practice to reference the original author and list as a source.
- Please include images in tweets so it’s easier for Eva to review, there’s also a higher chance of being included in the favorite viz if you do this.
Eva and Sarah provided great feedback, and I have made the following iterations:
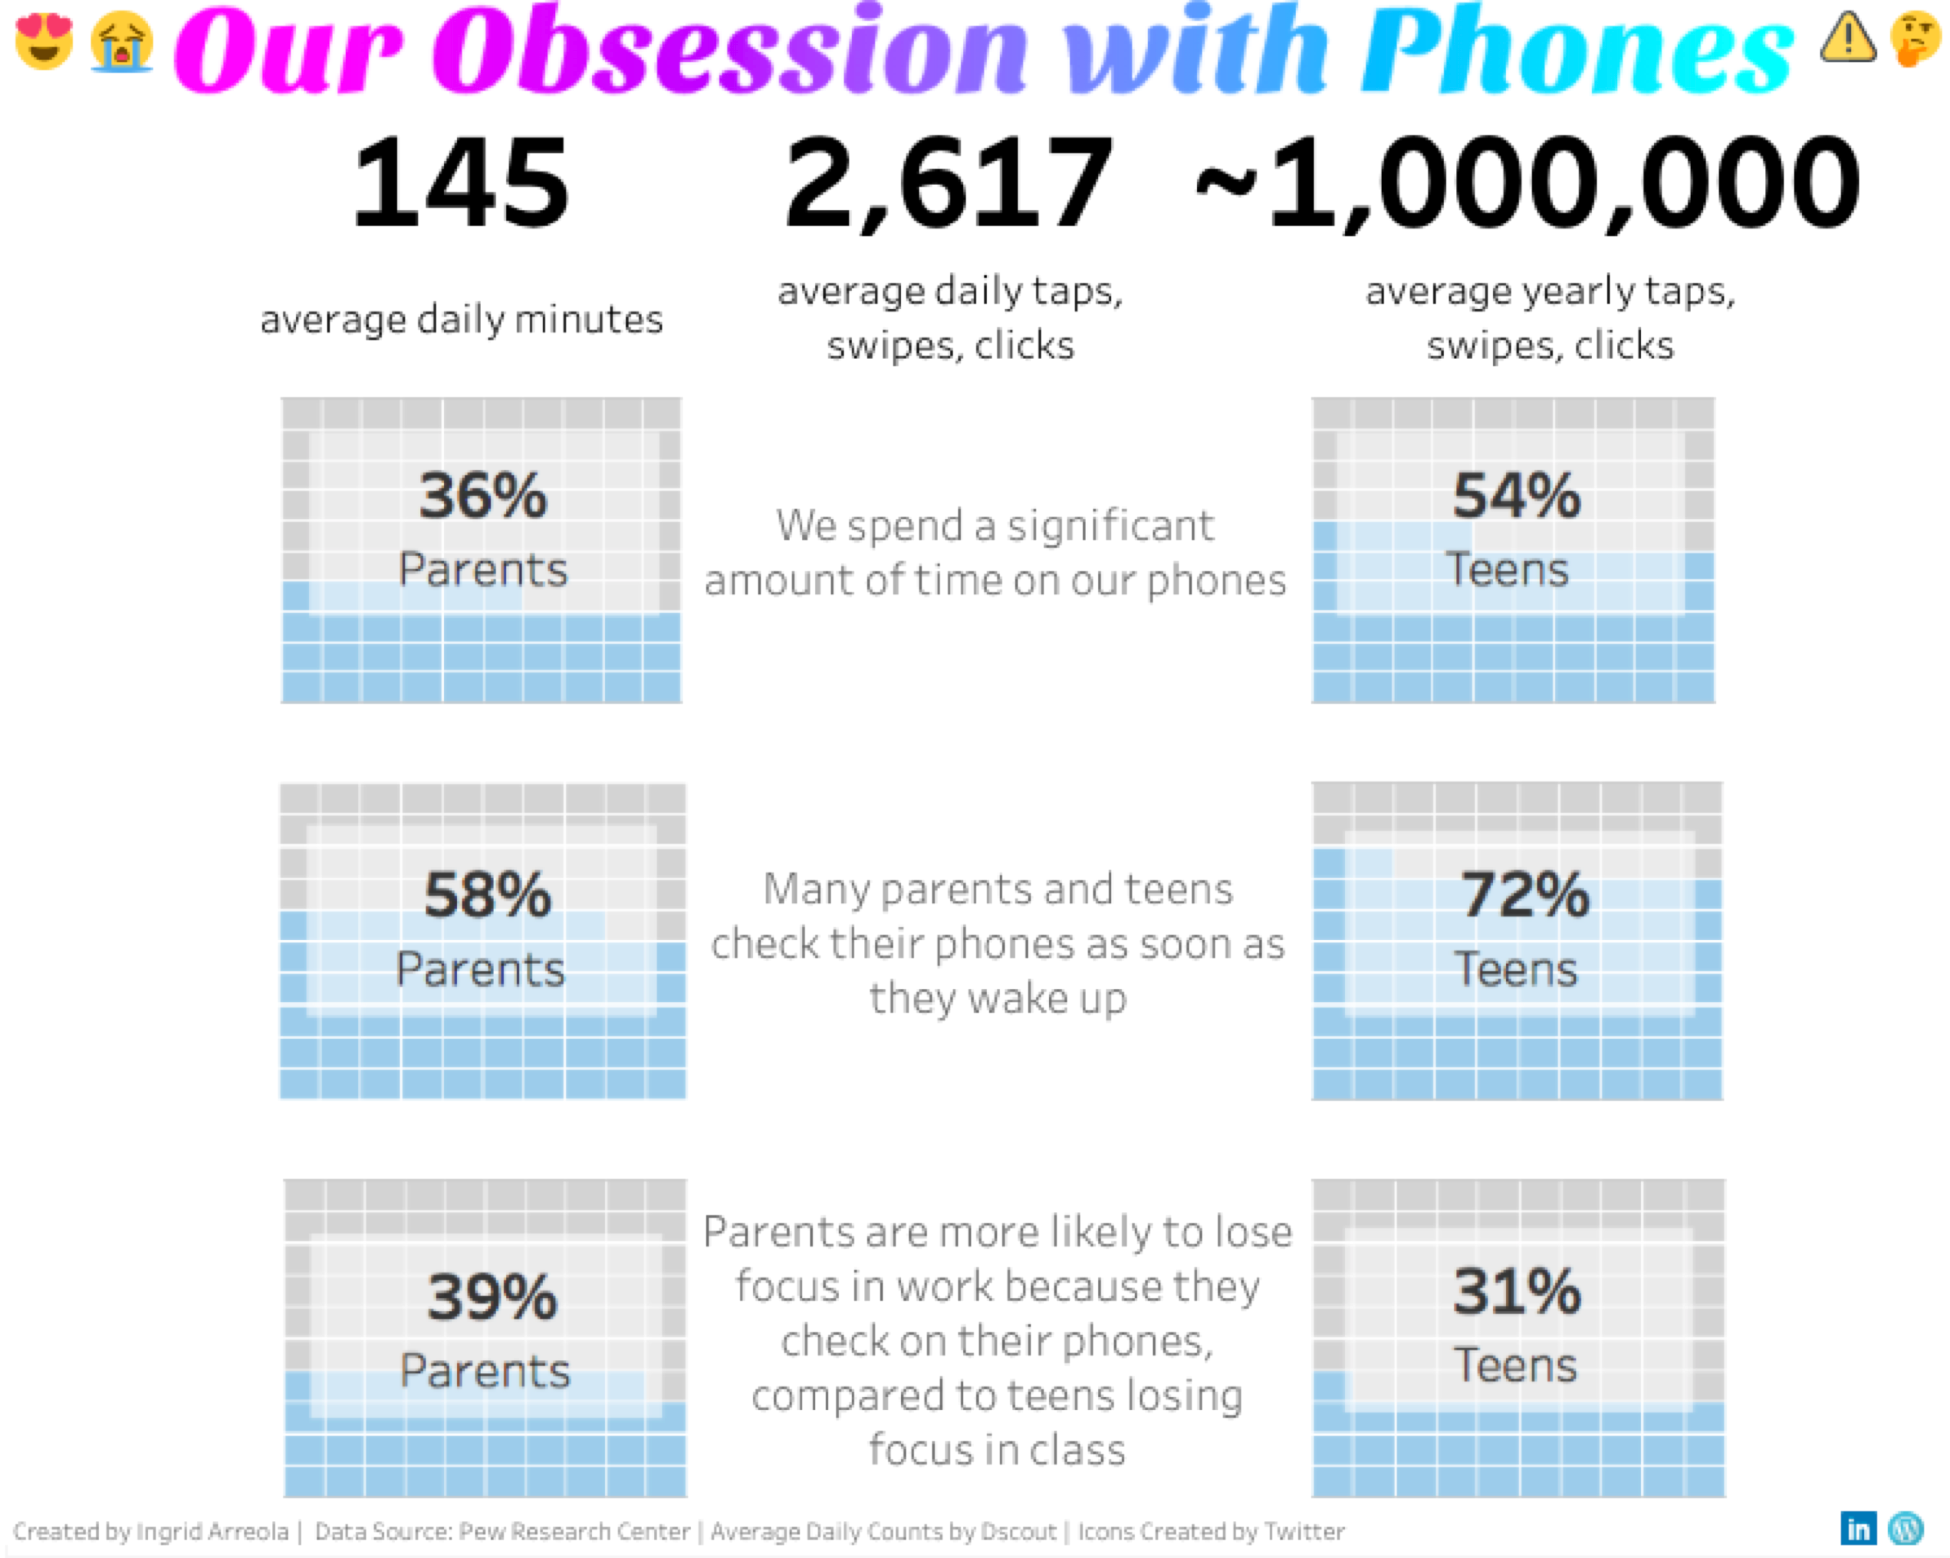
- Reduced the size of waffle charts so it’s more a square (rather than a rectangle)
- Differentiated which is parents and teens – label in middle of waffle chart
- Removed the text at very top, and moved this to the middle of charts
- Made the BAN number larger and the BAN text smaller
- TIP: use containers!
- TIP: rather than using bold we can use Tableau semibold & rather than reducing size we can use Tableau light
These tips are extremely helpful and I really appreciate the feedback! While some of these may be common practices, they are really helpful for someone who is still learning – thank you Eva and Sarah!
You can view the iteration here.