I’m an amateur, a data visualization enthusiast who experiments, loves to learn, and participate in community data viz challenges. In February, I learned about Tableau and really fell in love with this tool. My favorite thing about being an amateur in Tableau is that there’s an active community encouraging you, sharing their work, and providing feedback as you contribute. Throughout the past few months I’ve been able to get a lot of ideas out into the world and I share as often as I can. I’d like to encourage you to share the work that you do, and teach someone else — especially if you’re new to a tool (i.e. Tableau) or a language (i.e. SQL) like I am. Together with my teammate Aubrey, we co-led a session on Tableau and walked through the basics of Tableau and data visualization. Our audience was broad where some folks were familiar with data, and others had never heard of Tableau.
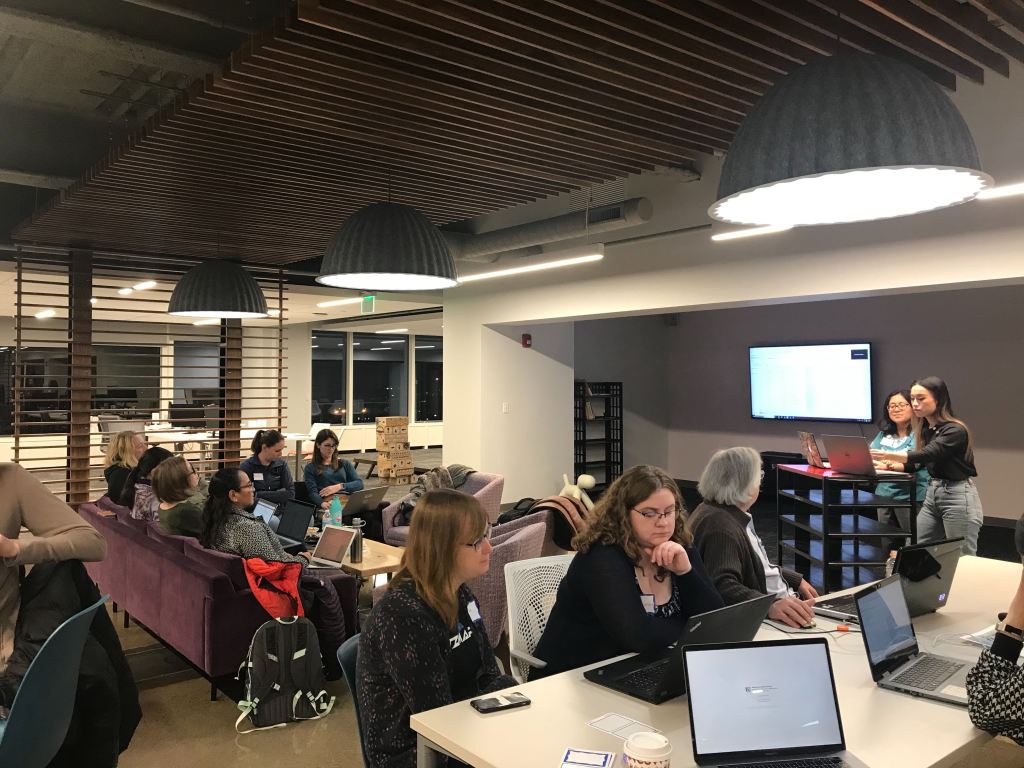
Sharing and teaching is a great way to practice your subject, you will receive education in return, and inevitably you learn new things. How do you do this? Basics include: (1) finding space to host a meetup — which can be facilitated by engaging with a community. (2) Finding a public dataset, preparing a few challenges relevant to the data, and providing a demo on Tableau. (3) A partner is great to have as well, luckily my teammate Aubrey is a pro and has been using Tableau for several years. Aubrey and I led this lesson in a Collab and Code session with Women Who Code Indy.
(1) There was an open call for members of Women Who Code Indy to engage and lead a Collab and Code and I volunteered to lead a session on Tableau. Women Who Code is a community of over 180,000 members who are tech professionals, the mission of this organization is to inspire women to excel in technology careers. Women Who Code Indy recently launched their chapter and hosts Collab and Code – a meetup where an individual(s) creates challenges on a programming language or tool and guides the members to find the solutions.
(2) Public datasets are available through data.world, kaggle, github, and other sites. There’s also the classic Superstore data set from Tableau. The dataset we worked with was one about movies and came from Kaggle on IMDB movies. The presentation included an introduction to data visualization, an explanation about Tableau, Tableau Public, and several challenges to work through. The demo included a 101 on importing data, cleaning up data, dimensions, measures, discrete, continuous, and building various visualizations.
(3) I really enjoyed presenting with my partner and am a fan of collaboration. If you’re not able to find a partner, this can also be done as a solo adventure (I’m happy to pass along tips). Reach out to the Tableau community because people are very supportive. I had a great conversation with Tableau Zen Master Chantilly Jaggernauth and received her guidance on structuring this talk, advice on facilitating an event like this one, and really appreciate her support!
Go and teach what you know! 🤓😎