Iron Quest: “a monthly community-led data visualization project…participants have a calendar month to source a suitable data set and then design, build, and submit a data visualization. Every viz should aim to showcase best practice & skill in design, storytelling & analysis.” Created by Sarah Bartlett and truly community-led with other data professionals, this is an opportunity to build and submit a data visualization.
Challenge: Visualize any dataset related to ‘Food & Drink.’ Find a data set and then design, build, and submit a data visualization.
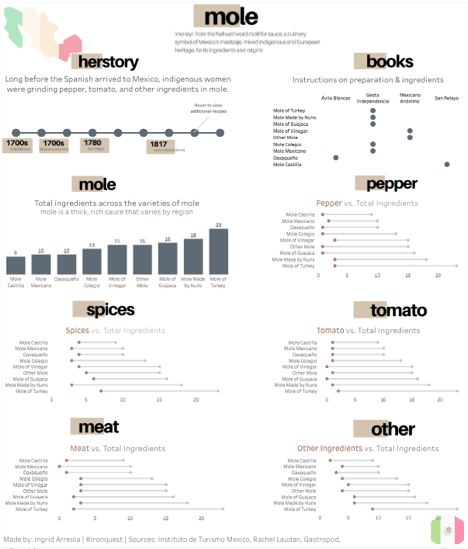
Mole: \\mo-lay\\ Its history is rich and its name comes from the Nahuatl word for sauce – mōlli. Mole, a thick, rich sauce, often served with meats and rice is available in many form and varieties. Mole has early references in writings as a dish served to the Aztec Moctezuma. Long before the Spanish arrived to Mexico, indigenous women were grinding chile, tomatoes, corn, and other ingredients found in mole. It is a culinary symbol of Mexico’s mestizaje, mixed indigenous and European heritage, for its ingredients and origins. This was the topic I chose to visualize for this Iron Quest challenge. I love and appreciate food, and I wanted the project to center on something meaningful. After considering several Mexican cuisines, I chose mole because it’s one of my favorite foods and my family is from Oaxaca (a state with deep ties to this cuisine).
Research: My initial step to all data related projects. Research on this food involved: researching its history, trying to find a data set, reaching out to restaurants, checking out books, browsing the internet. After a few hours the data source I found came from the Mexican government. “El Mole en La Ruta de Los Dioses” includes the history of mole, recipes dating back to the 1700s, and ingredients for several mole varieties. This was the data source that I needed, as it quantified this food and also connected to its history. The other breakthrough came through listening to a podcast on food — Gastropod — specifically the episode on mole.
Research Findings: The data source includes several books with information on mole: Ávila Blancas, Mexicano Anónimo, San Pelayo, and Gesta Independencia. These books include recipes and information on the ingredients used present in 10 types of mole. The dates range from the early 1700s, 1780s, and 1800s and also include instructions for the preparation of this complex dish. I found the focus of the story by breaking down the history, focusing on early ingredients, and quantifying the frequency of ingredients found across the variety of mole.
Design: This was challenging because there was both the history and the ingredients to focus on. Initially I was going to have a long dashboard focusing on the history and then slowly introduce ingredients. In the end I made a scrollyteling map to focus on the history and a visualization to focus on the ingredients. The storytelling map design is meant to have a vintage map feel as it walks through the history of mole – beginning closer to the Middle East, Spain, and then zooming into Mexico. The visualization focuses on a clean design leading the reader from the broad picture to the small details.

Data: This visualization required a search both far and wide before finding something that could be visualized. I looked at data.world, Kaggle, open food facts database, data.gov, academic papers, emailed several restaurants… all in search for a data set. I was initially worried and intimidated that I wouldn’t be able to find a ‘great’ data set (i.e. huge, impressive data set). In the end I was able to use information from a table of a government document focusing on mole. Everything was in Spanish, which was another layer of difficulty. Luckily, I had help with translation and overall data questions from Tableau Zen Master Rosario Gauna.
Final Visualization: This visualization starts out broad by looking at manuscripts and text that people in 1700s wrote on the preparation of mole. The timeline allows people to hover and view several descriptions about the preparation. There is also an overview on the data source itself by examining the four books and the varieties of mole that it explores. Next, there is a look at the total ingredients found in nine mole varieties. Finally, there is a breakdown of the ingredients by categories (i.e. peppers, spices, etc.) and by mole variety. The visualization is available on Tableau Public.
Storytelling Map: The journey on the history of mole was built with an interactive storytelling template on Mapbox. This is a guided narrative with a map, this format is used to tell stories. I was captivated by the rich history of mole and wanted a different medium to portray this story. This is available on my Github page.
The storytelling map was perfect because this story is shaped by location. I’ll be writing a future post about how this can be created. More information can be found on the Github storytelling mapbox template, mapbox demo example, and a Mapbox medium post about how to build this.
